Gauges – how deep is the Tidal Trent?
In coastal navigation, a skipper normally refers to a chart to determine the charted depth along their route, then checks “Tide Tables” to find the predicted rise or fall of the tide at a given place and time. By adding the tidal height to the charted depth, they can estimate the total available water depth and whether their vessel will be able to pass safely.
However, in the upper reaches above Gainsborough, reliable charts are limited and there are no dependable tide tables for predicted water heights. Even the Admiralty no longer attempts to forecast low-water levels above Keadby.
Because of this, the following method is offered as a best-available guide only and should not be relied upon for safe navigation. For authoritative information, users should consult the appropriate navigation bodies (Canal & River Trust upstream of Gainsborough, and Associated British Ports downstream).
The method uses two key elements:
First, an estimate of baseline minimum depths at average low water along the “Red Line” route shown on the Boating Association map. This is based on Canal & River Trust survey data from March 2022, combined with limited corrected readings from informal sonar surveys carried out by recreational navigators. The best general estimate suggests around 1.6 metres between Cromwell and Gainsborough, although in certain shallow areas this may reduce to approximately 1.2 metres.
Second, an approximation of river level relative to a standard low-tide baseline. While high and low tide times can be estimated, the actual height varies significantly depending on upstream freshwater flow, which can change rapidly and unpredictably. The referenced website displays this water level in the final column, showing the additional height above normal low tide.
For example, between Cromwell and Gainsborough:
If the water level is 2.0 metres above normal low tide, the expected depth would be at least 3.2 metres (2.0 + 1.2 = 3.2).
During very low river conditions, if the level is -0.3 metres, available depth could reduce to about 0.9 metres (-0.3 + 1.2 = 0.9).
The linked application uses data from four Environment Agency flood gauges along the tidal section. Its final column provides an approximate indication of additional water depth above normal low tide, with an estimated one-hour delay in the readings.
This link takes you to our APP that uses the four “Flood Gauges” provided by the Environment Agency on the tidal stretch. The final column gives an indication (with a one hour lag) of how much “extra” water there is, above the normal low tide.
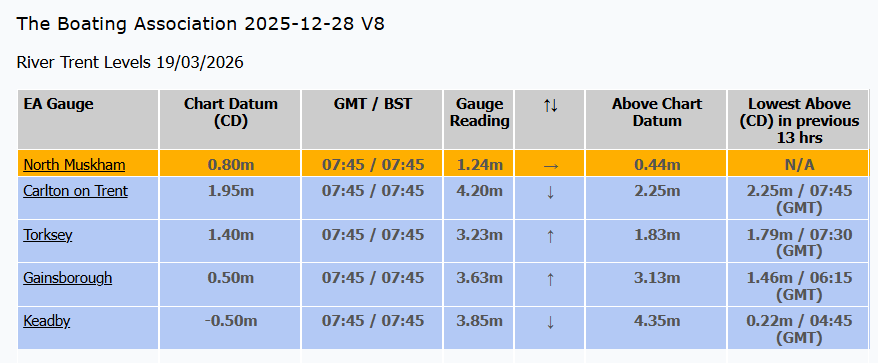
A brief explanation of each column in the table follows …
| STATION | Self explanatory – but each name can be “tapped” to take you direct to the actual EA Gauge. The “North Muskham” Gauge is different in that it is “non tidal” but is the gauge that gives us the advisory “Flood/ Fast Flow Warnings” for the whole tidal section. The colour here changes automatically | |
| GMT/BST | The time of the last reading this software is considering. Unfortunately, while the Gauges usually update every 15mins on the tidal section, it takes time for that information to become available, so this information can be up to an hour late – Keadby in particular has potentially an even bigger delay. If you want the most up to date number, go to the EA Gauge… | |
| GAUGE | This is the actual reading on the EA Gauge. It is linked to a local “datum” that is NOT the depth of water at that location.. “” +/-” – is the indicator of a rising or falling water level at this location (You can follow the progress of a tide as it moves upstream!) | |
| CHART DATUM (CD) | This figure doesn’t change, and is the correction that has to be applied to each location to convert the Gauge Readings to “Height above Chart Datum” – the tidal readings that navigators require. | |
| ABOVE CHART DATUM | Is the height of tide and fresh at this Gauge at the time shown. Note that Keadby frequently goes “negative” which suggests the “Chart Datum” here is incorrect, in isolation this is of limited concern in these lower reaches. Other locations will go negative only when river levels are low, and may be cause for concern if your boat draft is 1.0 metre or more, or if this number becomes significant. | |
| PREVIOUS LOW +/- CD | The most useful colum for day to day river use! This is the time (note it’s in GMT, so add an hour in summer!) of the last “low water”. You will see the “low water” moves up the river from Keadby to Torksey and on to Carlton – but you may find when tides are weak, or “fresh” is high, Carlton gets seriously out of sequence! The last “Low water” here can generally taken as the “amount of Fresh at Carlton” which reflects, but may not be the same as the “Fresh at Cromwell ” supplied by the lock keepers. Finally…. No… They don’t all have the same amount of water “above datum” on each tide! AND…. this is the time of the lowest level on that tide….. It is NOT necessarily when the tide turned. The “First Flood” when the lock keeper will let you out to go upstream can be significantly later than the “low tide” at all these locations – but the further up the river you go… The bigger the gap MAY be |
This may seem complex at first glance, but in practice it is fairly straightforward for most boaters.
If your vessel draws 1.0 metre or less, this information is unlikely to be important except during periods of unusually low water, such as summer droughts. In such situations, it is hoped that lock keepers will be able to provide advance warnings in the same way they currently do during high river (flood) conditions.
If your boat draws more than 1 metre, it is advisable to read this guidance carefully, particularly when planning trips upstream of Gainsborough, and to save this page for future reference.
Important caution: If you obtain water level readings from Environment Agency gauges through other sources or links, be aware that the figures shown do not represent depth above the riverbed or chart datum. The values are referenced to a different baseline (such as Ordnance Datum Newlyn used by Ordnance Survey), which means they cannot be directly interpreted as navigable depth. These gauges are not designed for navigation purposes and may also become inaccurate without warning.
Disclaimer: All information provided here is offered in good faith as a general guide only and must not be relied upon for safe navigation. For accurate and up-to-date advice, always consult the appropriate navigation authority.